 JOSH
 SETH
 JAKE
 CONNOR
 BILL
 PAUL
 JIM
 NATHAN
CONNOR — Active ESPN Roster 126.51proj
| Slot | Player | Team | %ST | ESPN | Sleeper | ADJ PROJ | Matchup |
| QB |
 Thu |
34% | 17.99 | 17.34 | 17.66 | ||
| RB1 |
 Sun |
95% | 19.32 | 18.51 | 18.91 | ||
| RB2 |
 Sun |
99% | 15.15 | 17.84 | 16.5 | ||
| WR1 |
 Sun |
43% | 19.83 | 19.43 | 19.63 | ||
| WR2 |
 Sun |
86% | 16.06 | 15.38 | 15.72 | ||
| TE |
 Sun |
34% | 12.75 | 12.91 | 12.83 | ||
| FLEX |
 Sun |
96% | 19.84 | 19.76 | 19.8 | ||
| DST |
 Sun |
46% | 4.36 | 6.57 | 5.46 | ||
| K |

|
77% | 0.0 | — | 0.0 | — |
Bench benched in ESPN 69.32proj
| Slot | Player | Team | %ST | ESPN | Sleeper | ADJ PROJ | Matchup |
| QB |
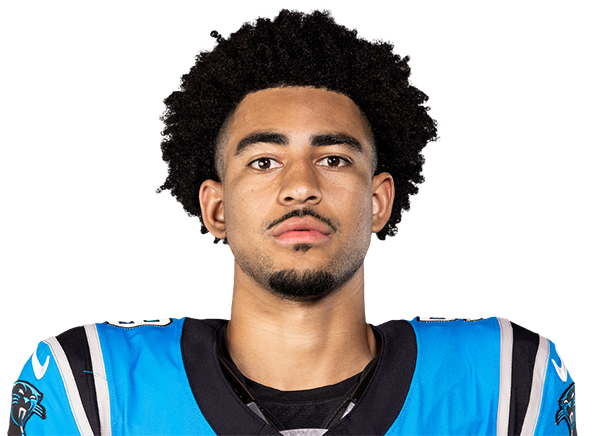 Sun |
50% | 17.93 | 18.02 | 17.98 | ||
| RB |
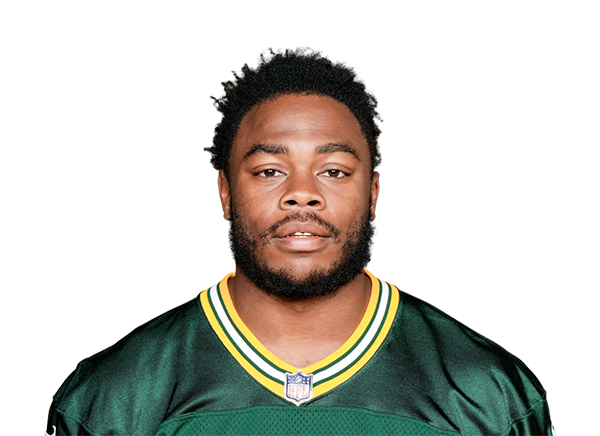
 Sun |
56% | 7.86 | 7.89 | 7.88 | ||
| WR |
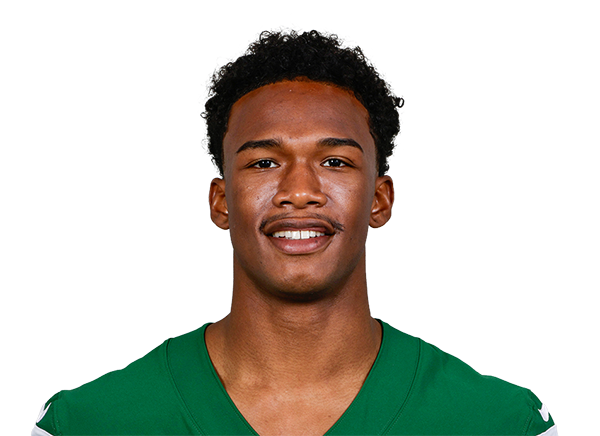
 Sun |
89% | 15.27 | 16.66 | 15.96 | ||
| WR |
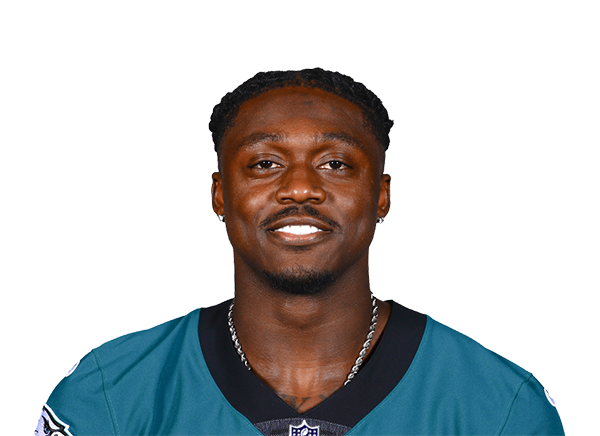
 Thu |
43% | 16.25 | 14.81 | 15.53 | ||
| TE |
 Sun |
71% | 12.24 | 11.7 | 11.97 | ||
| DST |
|
48% | 0.0 | — | 0.0 | — |
Game-day decisions 1 still unresolved
| bench | A.J. Brown QUES | Inactives in 2d 4h, then 1h 30m to act. |
A team must submit its inactive list 90 minutes before kickoff; until then "Questionable" means they have not decided, and nobody outside the building knows. Your league locks each player at his own kickoff — not at the first game of the week — so that 90 minutes is real time to act, and a Thursday player has to be settled three days before a Sunday one. This page refreshes every five minutes once a window is open.
IR slot empty 6on bench
JAKE — Active ESPN Roster 117.08proj
| Slot | Player | Team | %ST | ESPN | Sleeper | ADJ PROJ | Matchup |
| QB |
 Sun |
70% | 18.96 | 16.96 | 17.96 | ||
| RB1 |
 Sun |
32% | 9.28 | 11.2 | 10.24 | ||
| RB2 |
 Sun |
62% | 6.59 | 3.7 | 5.14 | ||
| WR1 |
 Sun |
99% | 20.47 | 22.82 | 21.64 | ||
| WR2 |
 Mon |
99% | 18.85 | 17.68 | 18.27 | ||
| TE |
 Sun |
43% | 8.69 | 10.69 | 9.69 | ||
| FLEX |
 Sun |
85% | 16.97 | 17.84 | 17.41 | ||
| DST |
 Sun |
89% | 6.41 | 6.74 | 6.58 | ||
| K |
 Sun |
89% | 11.26 | 9.04 | 10.15 |
Their bench on ESPN's bench right now 92.33proj
| Slot | Player | Team | %ST | ESPN | Sleeper | ADJ PROJ | Matchup |
| RB |
 Sun |
41% | 14.75 | 14.85 | 14.8 | ||
| RB |

 Mon |
26% | 14.95 | 13.77 | 14.36 | ||
| RB |
 Sun |
23% | 12.39 | 10.64 | 11.52 | ||
| WR |
 Sun |
59% | 15.67 | 13.97 | 14.82 | ||
| WR |
 Sun |
59% | 12.51 | 12.63 | 12.57 | ||
| WR |
 Sun |
46% | 11.28 | 13.69 | 12.48 | ||
| WR |
 Sun |
48% | 12.3 | 11.25 | 11.78 |
This Week's Signals what the projections do not say
Injuries on your roster
-
A.J. Brown
bench
Questionable — Right Ankle (Sprain). Expected back week 7.In his return from a four-game absence Sunday against the Jets, Brown was targeted 10 times but hauled in only three of them for 27 yards. It appears he's still bothered by his previous right ankle sprain, as evidenced by a capped walkthrough Monday, but he still has two more chances to get back to full this week before potentially being tagged with a designation for Thursday's contest at Chicago.
Game environment market odds
-
Bryce Young
sunny.
-
Kyren Williams
sunny.
-
Kenneth Walker
intermittent clouds.
-
Amon-Ra St. Brown
shootout: 53.5 total, the week's high end; intermittent clouds.
-
Garrett Wilson
low-scoring game projected: 38.5 total; sunny.
-
Sam LaPorta
shootout: 53.5 total, the week's high end; intermittent clouds.
-
Jonathan Taylor
hazy sunshine.
-
San Francisco 49ers
shootout: 50.5 total, the week's high end; sunny.
Extreme matchups
-
Bryce Young
soft
vs TB — ranks 30 of 32 -- one of the softest defences against QBs.
-
Jonathan Taylor
tough
vs MIN — ranks 4 of 32 -- one of the hardest defences against RBs.
Context only — backtesting showed applying this as a projection adjustment made accuracy worse.
Sources disagree
-
Jonathan Taylor
ESPN 15.15 vs Sleeper 17.84 — a 2.69-point gap, with Sleeper higher. A gap this size usually means the two disagree about his role, not his talent.
-
San Francisco 49ers
ESPN 4.36 vs Sleeper 6.57 — a 2.21-point gap, with Sleeper higher. A gap this size usually means the two disagree about his role, not his talent.
Bench same columns, for comparison
| Pos | Player | Proj rk | Opp D | Proj | Split | Floor–ceil | Season rk | PPG | YPG | REC | CAR |
| QB |
Thu
|
QB13 | NE 19 | 17.66 | 8–27 | QB7 | 20.83 | 274 | 0.0 | 6.3 | |
| WR |
Sun
|
WR16 | TB 11 | 15.72 | 4–27 | WR13 | 17.82 | 94 | 6.4 | 0.0 | |
| WR |
Thu
|
WR17 | CHI 24 | 15.53 | 3–28 | WR33 | 5.65 | 26 | 3.0 | 0.0 | |
| TE |
Sun
|
TE6 | DET 24 | 11.97 | 3–21 | TE9 | 9.4 | 42 | 4.2 | 0.3 | |
| RB |
Sun
|
RB35 | KC 3 | 7.88 | 0–18 | RB49 | 9.38 | 59 | 0.8 | 14.5 | |
| DST |
|
DST31 | 0.0 | 0–2 | DST5 | 7.67 | 0 | 0.0 | 0.0 |
Outcome Range
20000 simulated matchups; 14 lineups evaluated. "Bad"/"good" are the 10th and 90th percentile margins.
Data
Variance measured from 5,687 player-weeks in 2025.
Team-mate correlation is not modelled, so a QB and his receiver are treated as independent — real ranges are slightly wider than shown.